India’s adoption of a new GDP series with 2022–23 as the base year marks a significant recalibration of national income measurement, aligning statistical practices with the structural transformation of the economy.
Growth Performance Under The New GDP Series
Recent Annual Growth Trends
Under the revised series, real GDP growth for FY 2025–26 is estimated at 7.6%, higher than 7.1% in FY 2024–25, while nominal GDP is projected to expand by 8.6%. Growth rates for the three years beginning FY 2023–24 are now more stable, ranging between 7.1% and 7.6%, compared to the earlier fluctuation of 6.5% to 9.2% under the previous base year.
Although nominal GDP levels are 3–4% lower relative to the earlier 2011–12 base series, this moderation is not considered unusual in rebasing exercises.
The revised series is widely regarded as offering a more accurate representation of economic activity.
Sectoral Contributions to Growth
Manufacturing has emerged as a major growth driver, recording double-digit expansion in FY 2023–24 and FY 2025–26.
The secondary and tertiary sectors have each grown by over 9% in FY 2025–26.
Within services, the ‘Trade, Repair, Hotels, Transport, Communication and Services related to Broadcasting and Storage’ segment expanded by 10.1% at constant prices in FY 2025–26.
Quarterly Performance
Real GDP at constant prices for the October–December quarter (Q3) of FY 2025–26 is estimated at ₹84.54 lakh crore, reflecting growth of 7.8%.
This marks a sequential strengthening from 7.1% in Q3 FY 2023–24 and 7.4% in Q3 FY 2024–25.
GDP represents the total value of final goods and services produced within a country during a specified accounting period.
Conceptual Framework Of GDP Compilation
Benchmark–Indicator Methodology
The revised estimates are prepared using the Benchmark–Indicator approach. Annual GDP estimates serve as benchmarks, which are then extrapolated using high-frequency indicators such as monthly and quarterly data.
This approach follows the System of National Accounts (SNA) 2008 and the IMF’s Quarterly National Accounts Manual 2017.
Importance Of Methodological Consistency
Meaningful inter-temporal comparisons require consistent base years, methodologies, and data sources.
Revisions are therefore designed to ensure continuity, reliability, and improved representation of economic realities.
Revising The Base Year
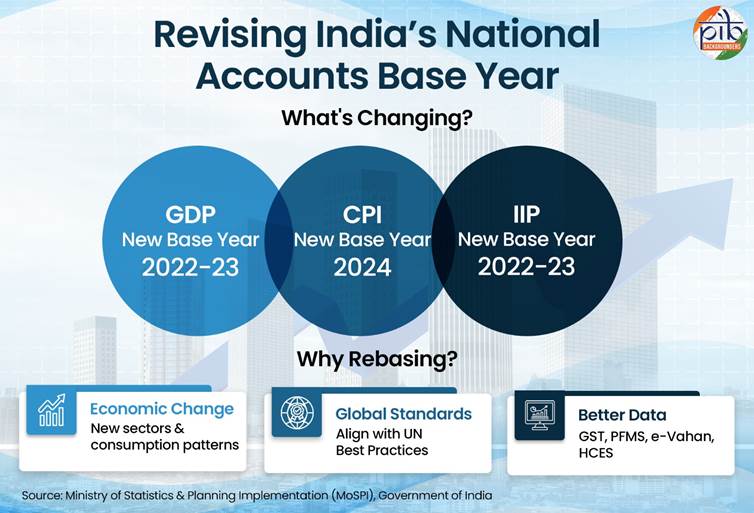
Meaning of Base Year
The base year is the reference year whose prices are used to compute real growth rates in national accounts statistics.
Rationale for Rebasing to 2022–23
The base year has been updated from 2011–12 to 2022–23 to better capture structural shifts in the economy.
The year 2022–23 was chosen as it represents the most recent “normal” year following disruptions caused by the COVID-19 pandemic during 2019–21.
Periodic rebasing enables the integration of improved data sources, methodological refinements, and emerging sectoral contributions.
Structural Changes Captured
Over the past decade, India’s economy has seen expansion in renewable energy, digital services, and evolving consumption and investment patterns. Rebasing allows these developments to be reflected more accurately.
The increased availability of high-frequency digital data from systems such as e-Vahan, PFMS, and GST has strengthened the robustness of national accounts.
- Base Year Updated: GDP base revised from 2011–12 to 2022–23 to reflect structural economic changes.
- Real GDP Growth (FY 2025–26): Estimated at 7.6%, indicating stable expansion compared to earlier volatility.
- Nominal GDP Adjustment: Overall size of the economy revised downward by 3–4% under the new series.
- Manufacturing Momentum: Average growth of 11.2% (FY 2023–24 to FY 2025–26), supported by improved informal sector data and refined deflation methods.
- Agriculture Reassessment: Sector estimated ~5% larger; share increased to 18.2% in 2022–23 due to better crop coverage and lower fuel input costs.
- Services Performance: Trade-related services recorded 10.1% growth at constant prices in FY 2025–26.
- Quarterly Strength: Q3 FY 2025–26 GDP estimated at ₹84.54 lakh crore, growing at 7.8%.
- Improved Data Integration: Wider use of GST, ASUSE, PLFS, PFMS and digital databases enhances accuracy.
- Methodological Reforms: Introduction of double deflation and integration of Supply and Use Tables to reduce statistical discrepancies.
- Global Alignment: GDP compiled as per SNA 2008; transition toward SNA 2025 planned.
Data Enhancements In The Revised Series
Improved Household Sector Measurement
Earlier estimates relied heavily on proxy indicators. The revised series uses direct level estimates from the Annual Survey of Unincorporated Sector Enterprises (ASUSE) and the Periodic Labour Force Survey (PLFS), enabling improved assessment of informal and household sector activity.
Expanded Use of Administrative Data
GST data are used more extensively for cross-validation and state-level allocation of private corporate sector estimates. They also support quarterly compilation.
Data from the e-Vahan portal are incorporated for estimating Private Final Consumption Expenditure (PFCE) related to road transport services.
PFMS data enable the use of actual central government expenditure at the First Revised Estimates stage rather than relying on provisional figures.
Incorporation of Recent Studies
Updated rates and ratios derived from expert studies have been integrated, including research on grass and fodder, fisheries, milk and milk products, and transport services.
These refinements improve estimation accuracy and sectoral granularity.
Methodological Improvements In Estimation
Refined Deflation Practices
Double deflation has been introduced in manufacturing and agriculture, while single extrapolation applies elsewhere.
Deflators are now applied at a more granular level, incorporating over 260 item-level CPI indices.
Integration of Supply and Use Tables
The Supply and Use Table (SUT) framework has been aligned with national accounts to reconcile production- and expenditure-based GDP estimates.
By ensuring that total supply equals total demand, internal consistency is strengthened and statistical discrepancies are resolved.
Improved Treatment of Corporations and PFCE
Value added of multi-activity corporations is now distributed across activities using detailed turnover shares from MGT-7/7A filings.
PFCE estimation adopts a mixed methodology combining household expenditure surveys, administrative data, and the commodity flow approach, alongside implementation of COICOP 2018 classification.
Sectoral Realignments Under The New Series
Agriculture’s Revised Size and Share
The ‘Agriculture, livestock, forestry and fishing’ sector is estimated to be approximately 5% larger in current prices for the four years beginning 2022–23 compared to earlier estimates.
Agriculture’s share of GDP in 2022–23 rises to 18.2% under the new series, compared to 16.5% previously.
Despite this upward revision, the sector’s share declines over time, reaching 16.2% in 2025–26 under the new series.
The upward revision reflects greater inclusion of high-value crops such as fruits and vegetables, capturing the shift towards cash crops.
Additionally, reduced diesel usage and greater reliance on electricity and solar power—supported by the PM KUSUM scheme—have lowered input costs, thereby increasing value added.
Manufacturing’s Enhanced Growth
Manufacturing growth now averages 11.2% annually between FY 2023–24 and FY 2025–26, compared to 8% under the old series.
The shift away from the single-deflator method and improved informal sector data from ASUSE and PLFS contribute to this stronger performance.
Reassessment of the Informal Sector
The new series reduces reliance on formal sector proxies and incorporates more direct measurement of informal activity.
However, the GVA of ‘Trade, Repair, Hotels & Restaurants, Transport, Storage, Communication & Services related to Broadcasting’ is estimated to be significantly lower—by nearly 25% annually over FY 2022–23 to FY 2025–26—indicating improved accuracy rather than contraction.
Initial assessments from financial institutions and research bodies describe the revision as comprehensive, realistic, and credibly executed.
Strengthening Government And State-Level Estimates
Improvements in General Government Sector
Estimates now incorporate adjustments for the coexistence of the National Pension System and the Old Pension Scheme, imputation of government-provided accommodation, improved coverage of local bodies, and volume extrapolation for product subsidies.
Enhancing GSDP Consistency
The National Statistical Office provides methodological guidance to States and Union Territories to ensure uniformity in GSDP estimation.
With the new base year, allocation-based methods are being reduced in favour of direct estimation, reliance on fixed ratios is lowered, and state-level data usage is strengthened.
Future Reforms And International Alignment
Continuing Statistical Modernisation
The CPI base year is being revised to 2024, IIP to 2022–23, and WPI revision is underway. Plans are in place to incorporate the Producer Price Index.
Back-series data up to 1950–51 will be released after recalculation under the revised methodology.
Adherence to Global Standards
India compiles GDP in accordance with SNA 2008 and intends to transition to SNA 2025 in the next revision cycle.
As a subscriber to the IMF’s Special Data Dissemination Standard, India maintains adherence to global benchmarks of statistical quality and transparency.
Conclusion
The revision of the GDP base year to 2022–23 represents a substantive enhancement in India’s national accounting framework.
By integrating improved data sources, refined methodologies, granular deflation techniques, and the Supply and Use Table framework, the new series offers a more coherent and internally consistent measure of economic performance.
With real GDP projected to grow at 7.6% in FY 2025–26, the revised framework not only strengthens the credibility of official statistics but also provides a more reliable foundation for evidence-based policymaking and long-term economic planning.